📌 The Paradigm Shift: For a decade, Engineering Leaders have been slaves to their data. We spent hours building dashboards, days debating metrics, and weeks trying to turn insights into action. That era ends today. Keypup has officially transitioned into a fully autonomous NLP Software Development Analytics platform. We don't just show you data; we understand your intent, build your strategy, and monitor your success.
1. The Engineering Intelligence Crisis
Every CTO knows the "Dashboard Fatigue." You have Jira data in one silo, GitHub in another, and a BI tool that requires a PhD to generate a simple Cycle Time trend. By the time a dashboard is configured, the data is stale, and the team has moved on.
Traditional Software Development Lifecycle (SDLC) tools are passive. They wait for you to click. They wait for you to filter. They wait for you to interpret.
At Keypup, we realized that the future of engineering leadership isn't about more data—it’s about conversational agency. You shouldn't have to "build" a dashboard. You should simply tell your platform what you want to achieve, and the platform should execute.
2. Introducing the Autonomous Keypup AI Agent: From Chat to Action
Today, we are thrilled to unveil the most significant update in Keypup’s history. Our AI Agent is no longer just a "chatbot" sitting on top of your data. It is now a Full-Stack Analytics Partner capable of four revolutionary capabilities:
I. Prompt-to-Dashboard: Instant Infrastructure
Forget drag-and-drop. Simply describe a business problem—"I need to see why our releases are slowing down"—and the Keypup AI Agent instantly creates an entire, multi-insight dashboard.
It doesn't just pull random charts; it understands the semantic relationship between your Git repositories and Jira projects to select the most relevant KPIs.
II. Automated Contextualization (The "Zero-Config" Logic)
Every insight generated by the AI comes fully loaded. The AI Agent automatically:
- Sets the correct timeframes based on your sprint cycles.
- Configures deep drilldowns, allowing you to click from a high-level metric straight into the offending PR or Jira ticket.
- Writes the documentation for each insight, explaining what is being measured and why it matters for your specific team.
III. Deep Synthesis & Prescriptive Analysis
The AI doesn't stop at visualization. It performs a detailed post-game analysis of the dashboard it just built. It looks at the correlations—identifying that a spike in "Change Failure Rate" is directly linked to a decrease in "Review Participation"—and narrates the story of your SDLC in plain English.
IV. The "Improvement Loop": Suggestion & Monitoring
This is the "Holy Grail" of Engineering Management. Once the AI identifies a bottleneck, it suggests specific improvement actions.
But here is the "sexy" part: if you agree with the suggestion, the AI Agent will automatically create a new monitoring dashboard specifically designed to track the success of that improvement action over the next 30 days. It is a self-healing system for your engineering culture.
3. Why Keypup is Unique in the Global Market
If you look at the current "Engineering Intelligence" landscape (LinearB, Jellyfish, or Waydev), they all follow a "Widget-First" philosophy. You are given a library of widgets and told to "Go build."
Keypup is NLP-First.
While others are trying to add a "chat bubble" to a static dashboard, we have rebuilt the core of Keypup to be an Autonomous Intelligence Engine.
| Feature | Traditional Tools | Keypup NLP-First |
| Setup Time | Days/Weeks | Seconds (Single Prompt) |
| Logic | User-Defined (Manual) | AI-Synthesized (Autonomous) |
| Actionability | Descriptive (What happened?) | Prescriptive (What should we do?) |
| Documentation | Manual Wiki Updates | Auto-Generated for every Insight |
| Closing the Loop | Manual follow-up | AI-created monitoring for improvements |
4. Seeing the Future: Three Radical Use Cases
To understand the power of this release, let’s look at two complex scenarios where the Keypup AI Agent transforms hours of work into a 10-second prompt.
The Problem: You’ve noticed a subtle "velocity drift" over the last two months. You need to know if the team is genuinely slowing down at the issue level or if the complexity of your GitHub PRs has increased. You need an objective benchmark—not based on gut feeling, but on historical data.
🤖 The Prompt: "Create a dashboard to benchmark our current Jira issue Cycle Time against our team’s 6-month historical average. Focus on identifying which specific GitHub Pull Requests are causing issues to stay 'In Progress' longer than our benchmark. Analyze the correlation between PR size and Cycle Time, then suggest a monitoring plan to keep our velocity within the top 20% of our historical performance."
Why this is advanced:
- Granular Correlation: The AI doesn't just look at high-level project status; it dives into the Jira Issue level and maps it to specific GitHub Pull Request metadata (size, number of comments, and review cycles) to find the "hidden" drag on velocity.
- Benchmarking: It autonomously calculates your team's historical baseline for the last 180 days. It then uses this as a dynamic "yardstick" to highlight current issues that are statistically underperforming.
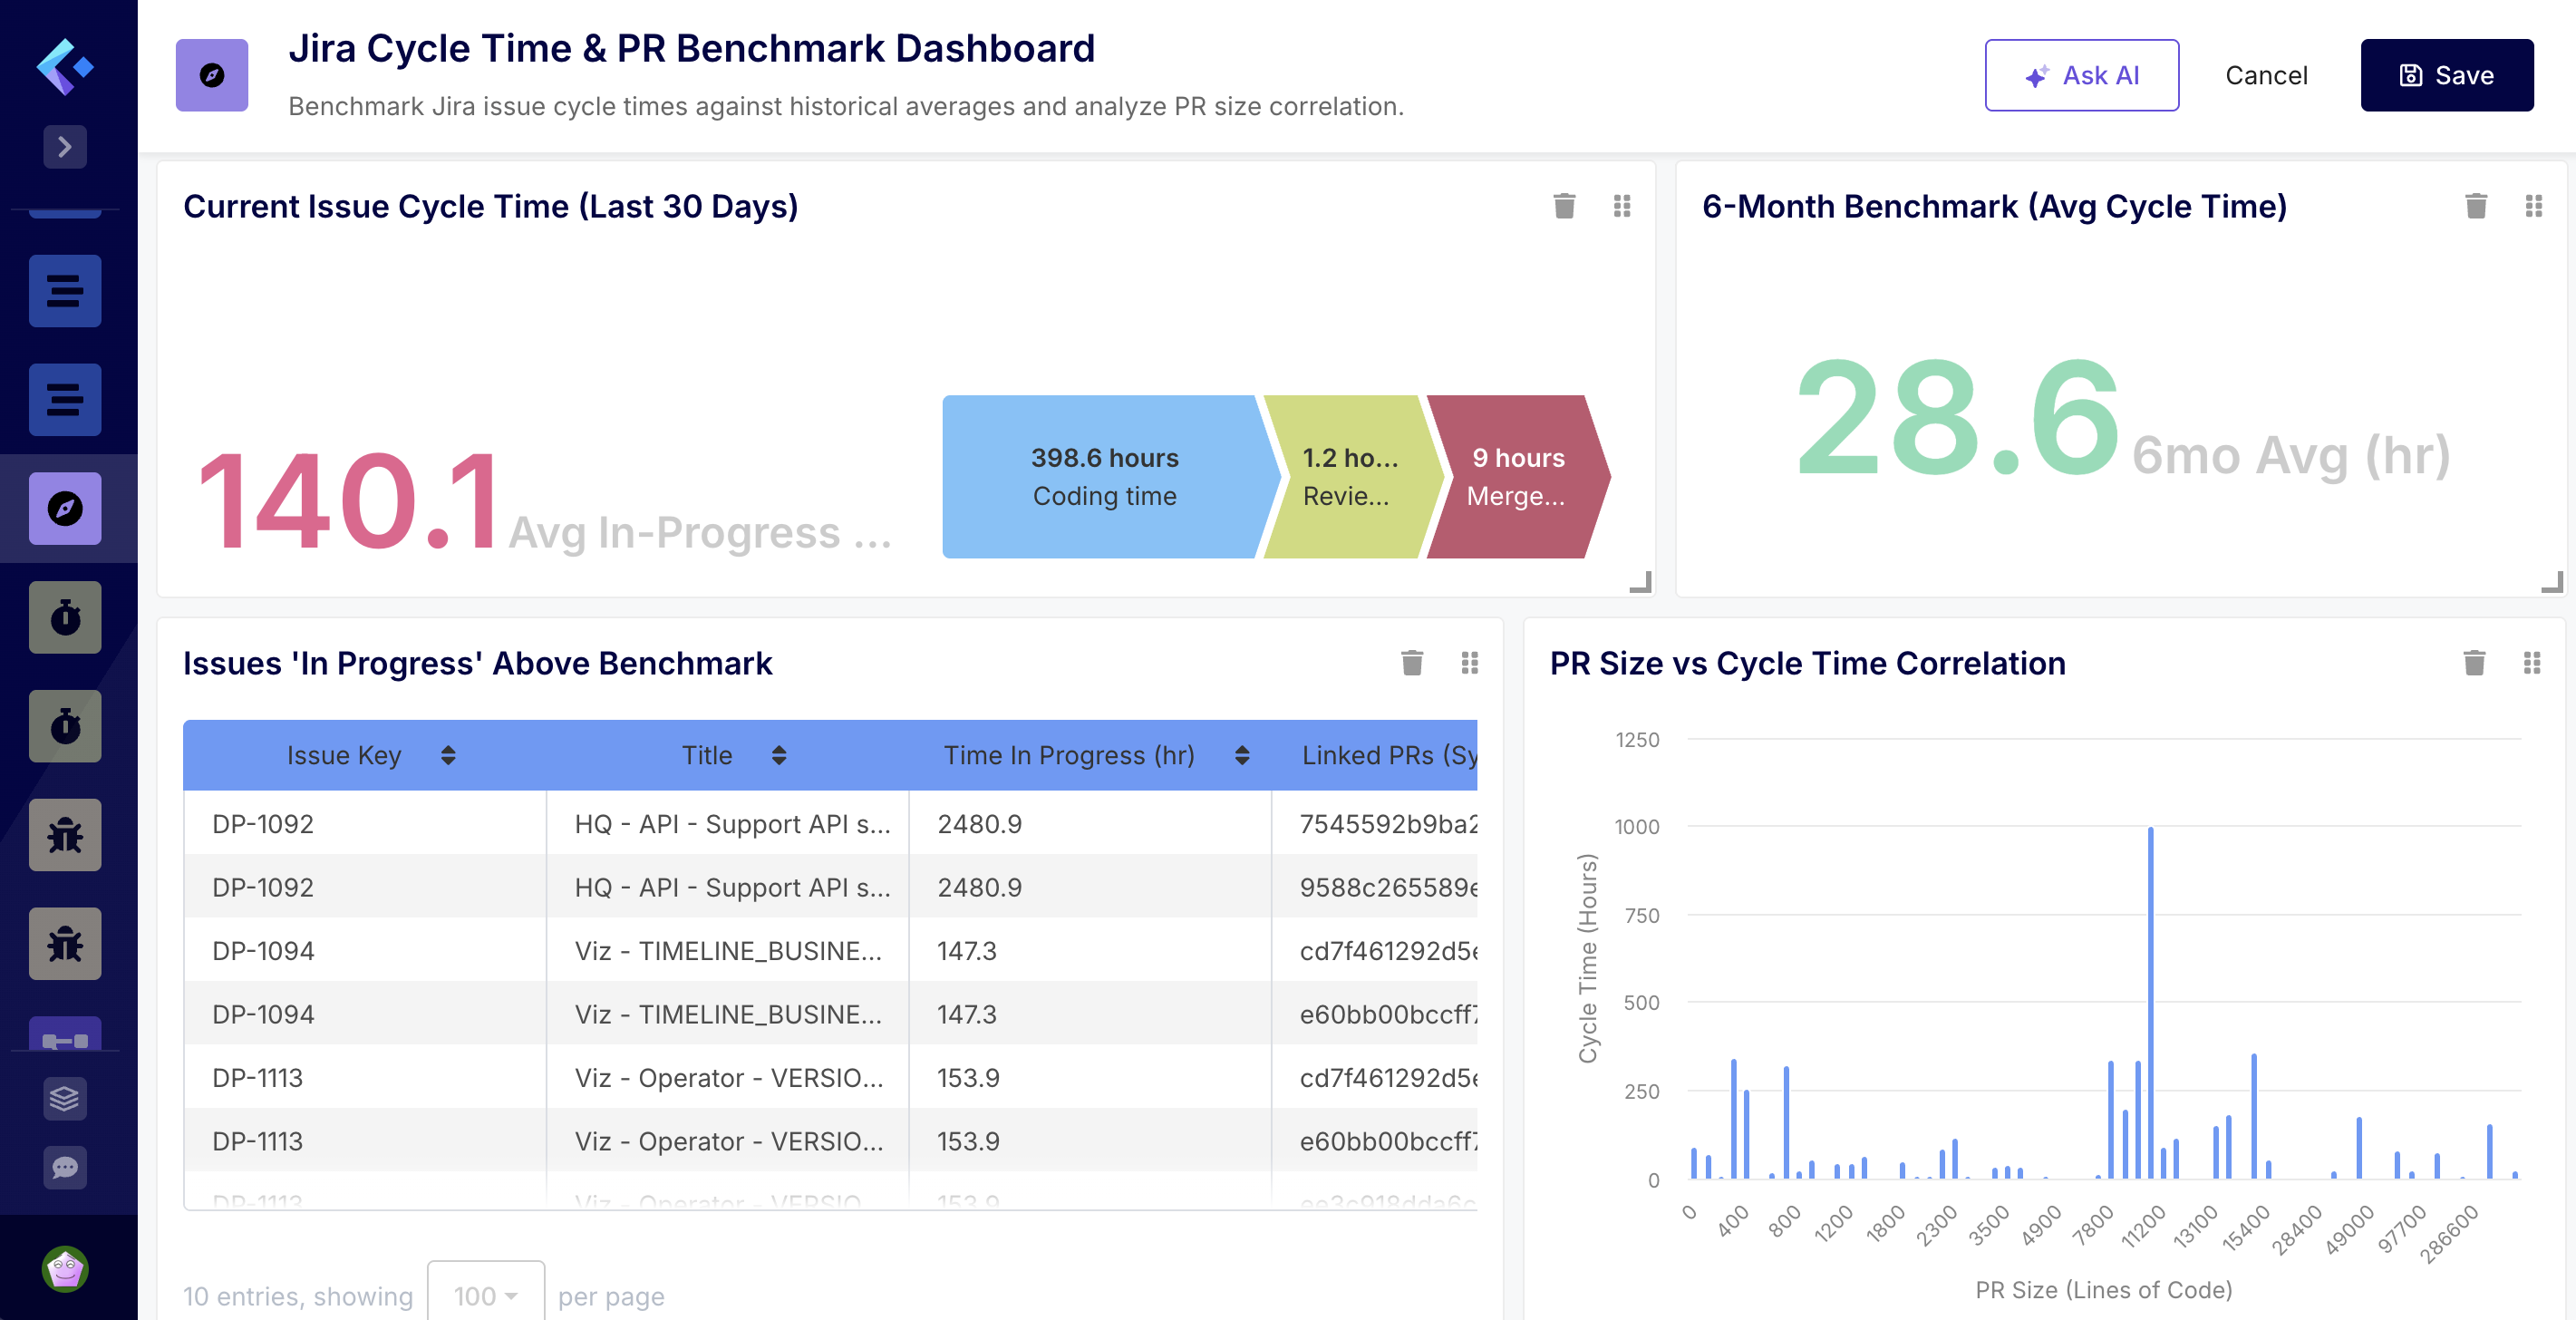
🔍 AI explains the dashboard I’ve created your Jira Cycle Time & PR Benchmark Dashboard to help you track performance and identify bottlenecks. :stopwatch:
Dashboard Summary:
- Performance Benchmarking: I’ve set up two side-by-side KPIs. One shows the average time spent ‘In Progress’ over the last 30 days, while the other provides your 6-month historical benchmark. This gives you an immediate view of whether current velocity is trending above or below your standard.
- Bottleneck Identification: The “Issues ‘In Progress’ Above Benchmark” list surfaces specific open issues that have already exceeded the historical average. It includes a column for Linked PRs, allowing you to quickly identify which GitHub Pull Requests are holding up progress.
- Correlation Analysis: The “PR Size vs Cycle Time Correlation” chart groups PRs by their size (lines of code changed) and plots the average cycle time. This will help you visualize if larger PRs are the primary driver of longer lead times.
- Global Filter: A “Reporting Period” filter has been added to the top, defaulted to the last 6 months, so you can adjust the historical scope of all charts at once.
- Prescriptive Analysis: The AI Agent interprets the data.
💡 Quick Data Analysis
- Current Performance: Your average time ‘In Progress’ for the last 30 days is 153.9 hours.
- Historical Benchmark: Your 6-month average is significantly lower at 28.6 hours. This suggests a recent slowdown in velocity.
- Top Bottlenecks:
- DP-607 (Integrate builds): Has been in progress for over 17,000 hours (likely a stale issue).
- DP-1092 (HQ - API - Support API scopes): Has been in progress for 2,471 hours.
- DP-1113 & DP-1114: Both are currently at 144 hours, roughly 5x your historical benchmark.
- Self-Correcting Action: The AI agent offers recommendations based on the analysis.
📈 Recommendations
- Stale Item Cleanup: Issues like DP-607 and DP-1092 are heavily inflating your current cycle time. I recommend closing these if the work is no longer active or splitting them into smaller, manageable tasks.
- Size Matters: Check the new Correlation Chart—if cycle times spike at the 300-400 LOC mark, enforce a “Small PR” policy to bring your current 153.9-hour average back down toward the 28.6-hour benchmark.
📊 To keep your velocity within the top 20% of your historical performance, I recommend:
- WIP Limits: Use the “In Progress” list to flag any issue that hits 80% of your benchmark time.
- PR Sizing: Based on the correlation chart, if you see cycle time spike significantly at a certain LOC threshold (e.g., >300 lines), implement a team policy to break down PRs before they reach that size.
- Weekly Review: Review the “Above Benchmark” list during every sprint ceremony to unblock linked PRs before they stagnate.
Use Case B: The "DevEx & Flow Optimization" Dashboard
The Problem: You want to adopt the SPACE framework to improve developer well-being and efficiency, but you don't know where to start.
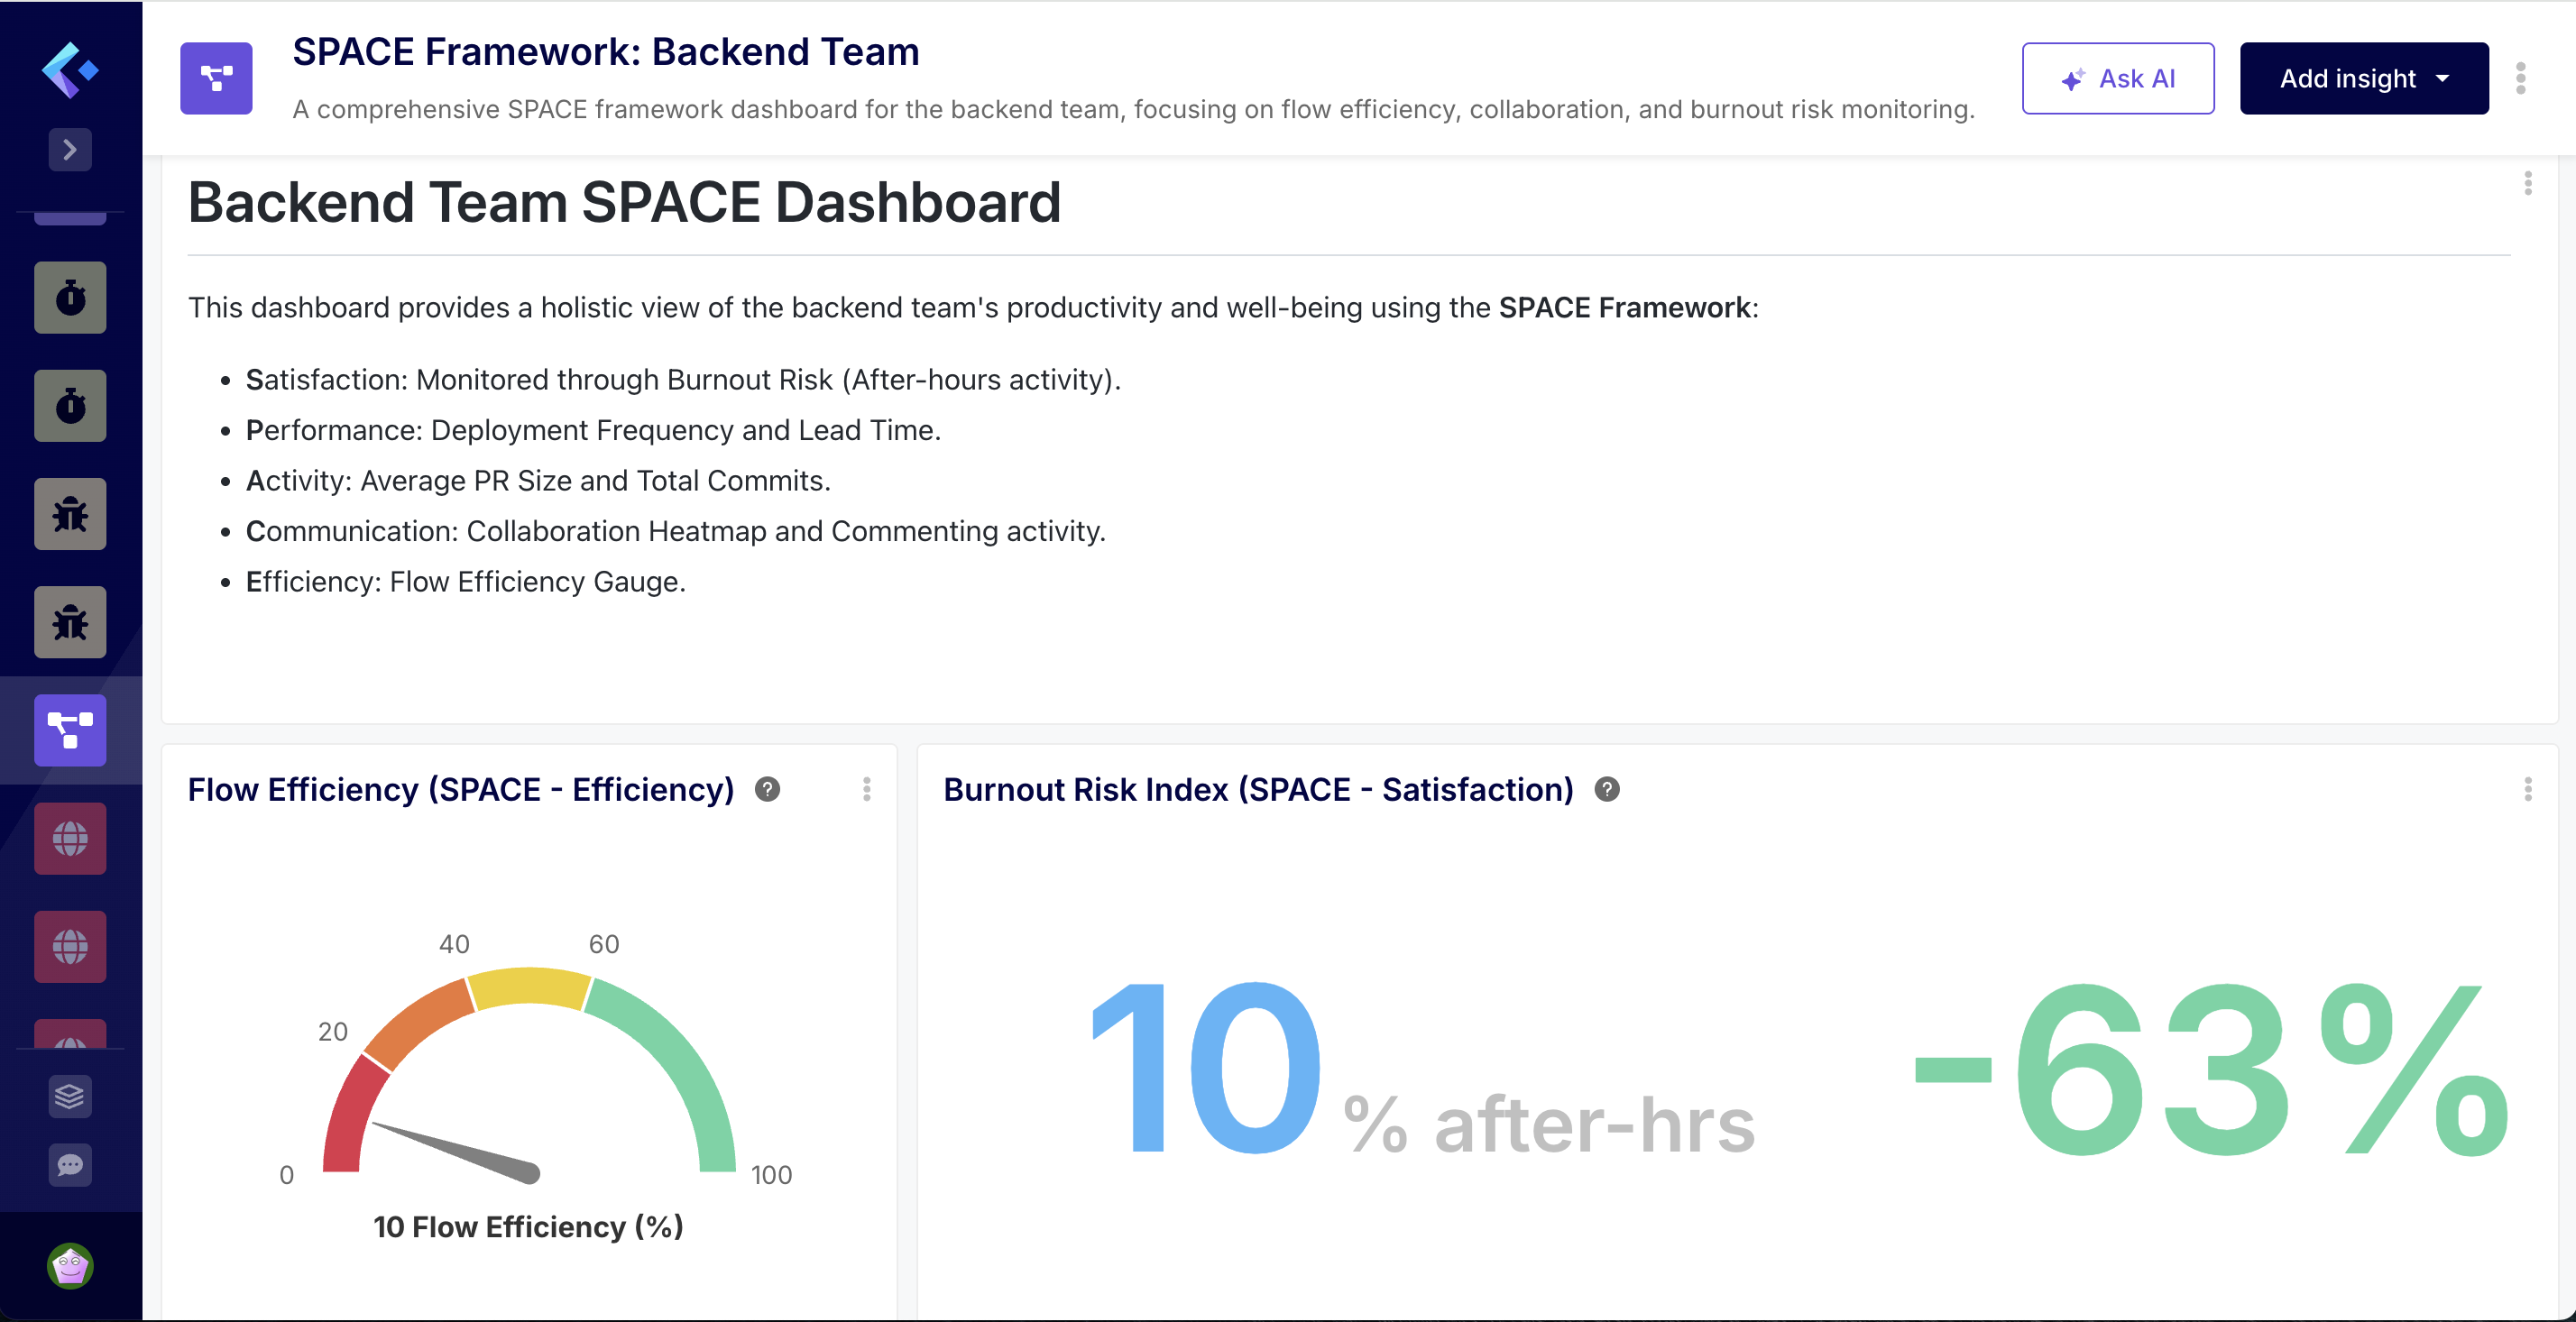
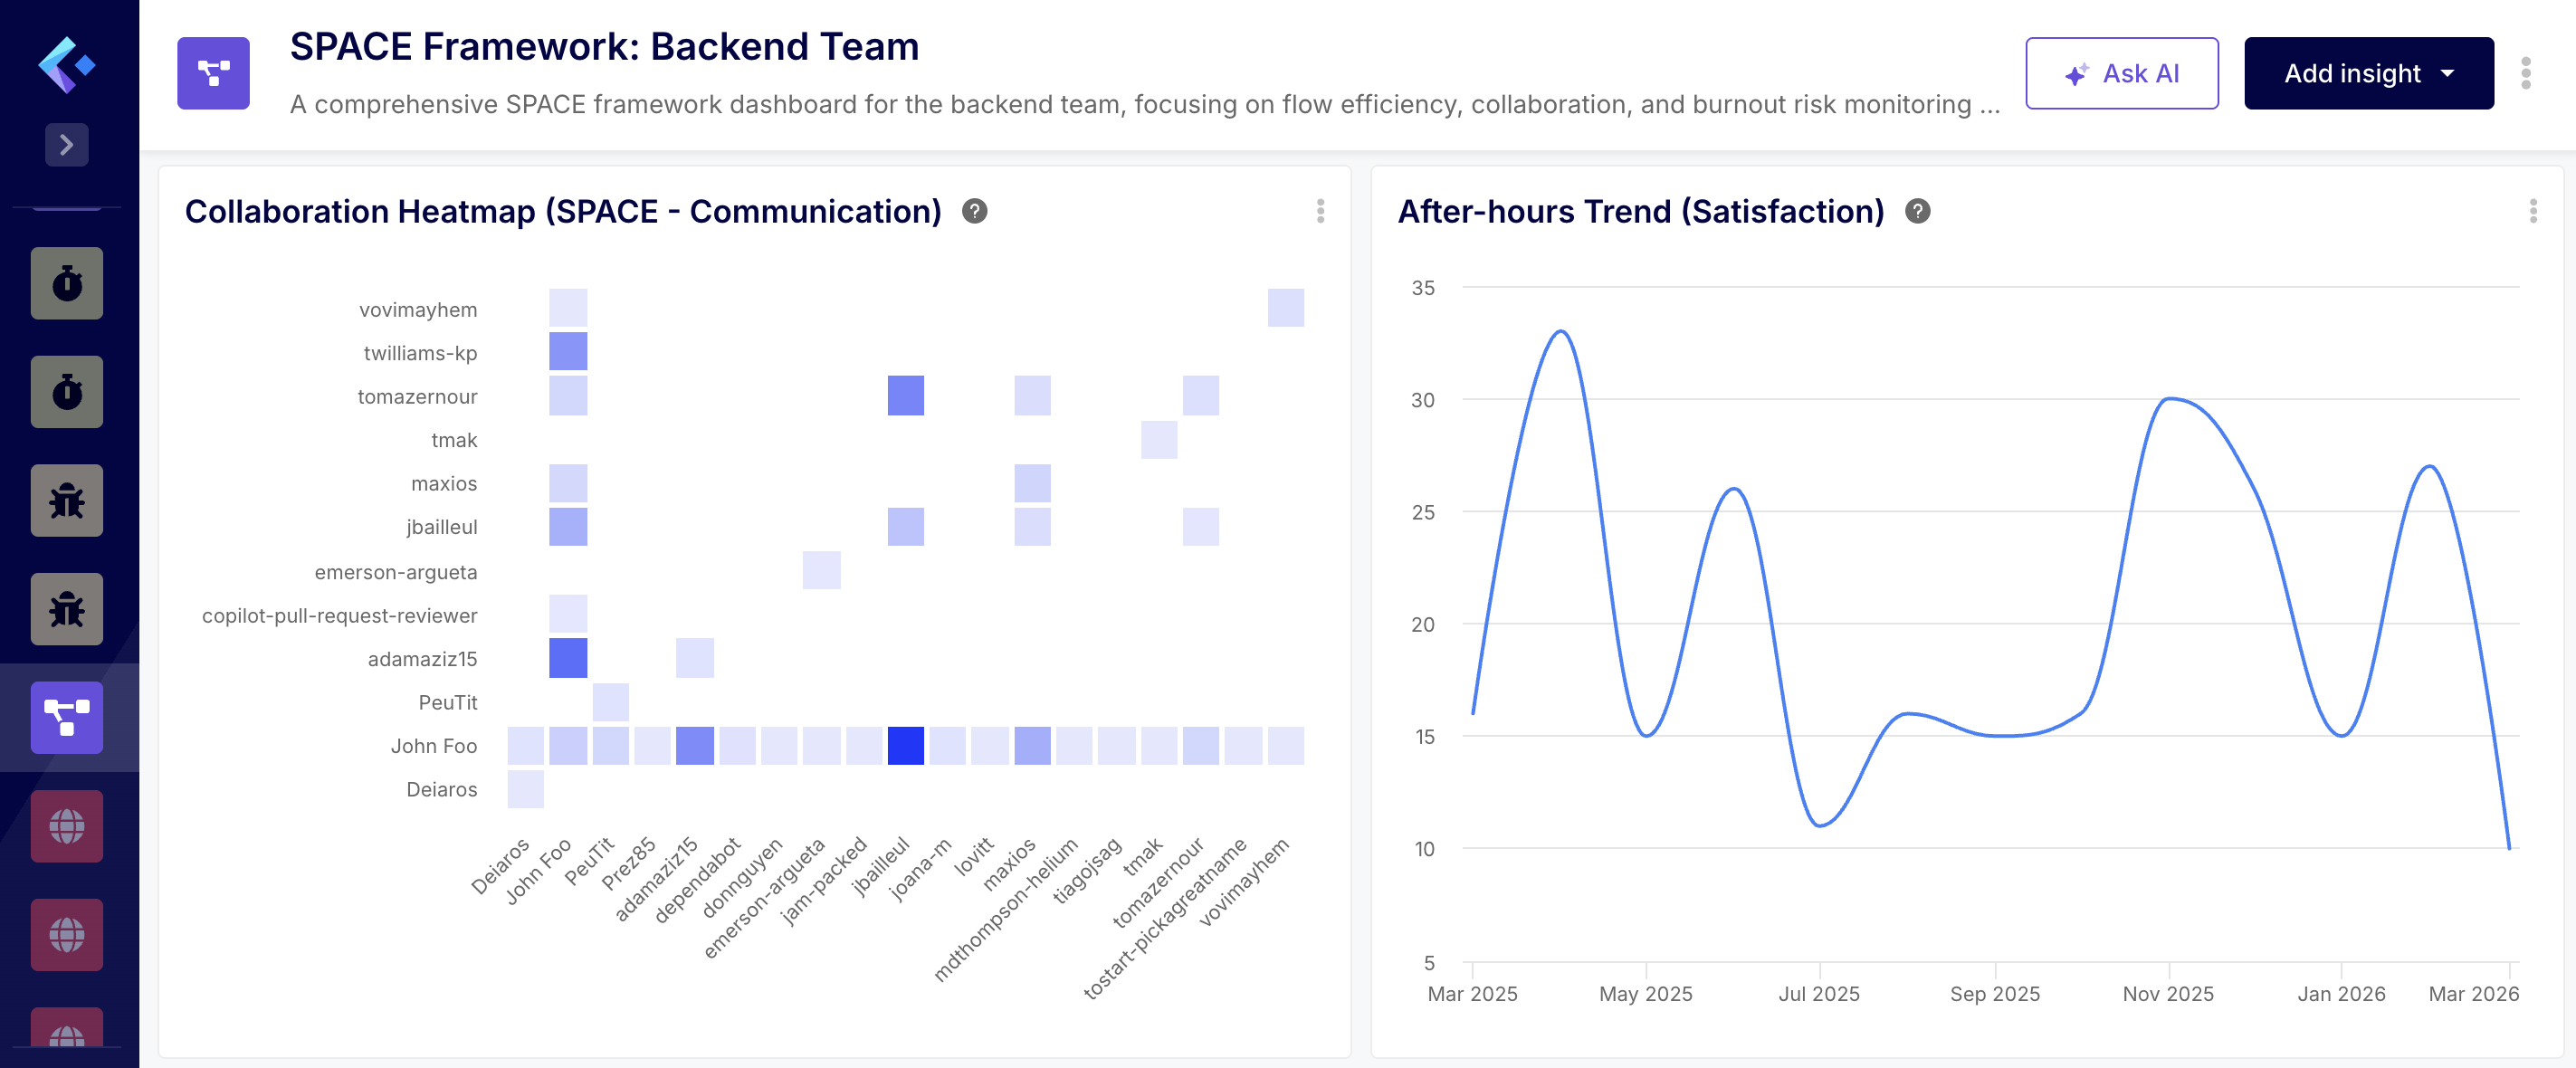
🤖 The Prompt: "Generate a SPACE framework dashboard for the entire backend team. I want to see our Flow Efficiency, our collaboration patterns, and an indicator of burnout risk based on after-hours activity."
Why this is advanced:
- The AI synthesizes disparate data: Git commit timestamps (for burnout), Jira transitions (for Flow Efficiency), and PR comments (for Collaboration).
- It creates a "Heatmap" of activity.
- The Analysis: The AI agent analyzes the data.
💡 Detailed Data Analysis
1. Satisfaction & Well-being (S)
- The Burnout Risk Index currently stands at 10% for March, which is within a healthy range (less than 15%). However, the historical trend shows significant volatility:
- Recent Stress: In February 2026, after-hours activity spiked to 27%, indicating a period of high pressure or a push for a major release.
- Pattern of Overwork: We see recurring peaks (30% in Nov 2025, 33% in April 2025). This suggests that while the team recovers, the workload periodically exceeds standard capacity, which is a leading indicator of burnout.
2. Performance & Activity (P)
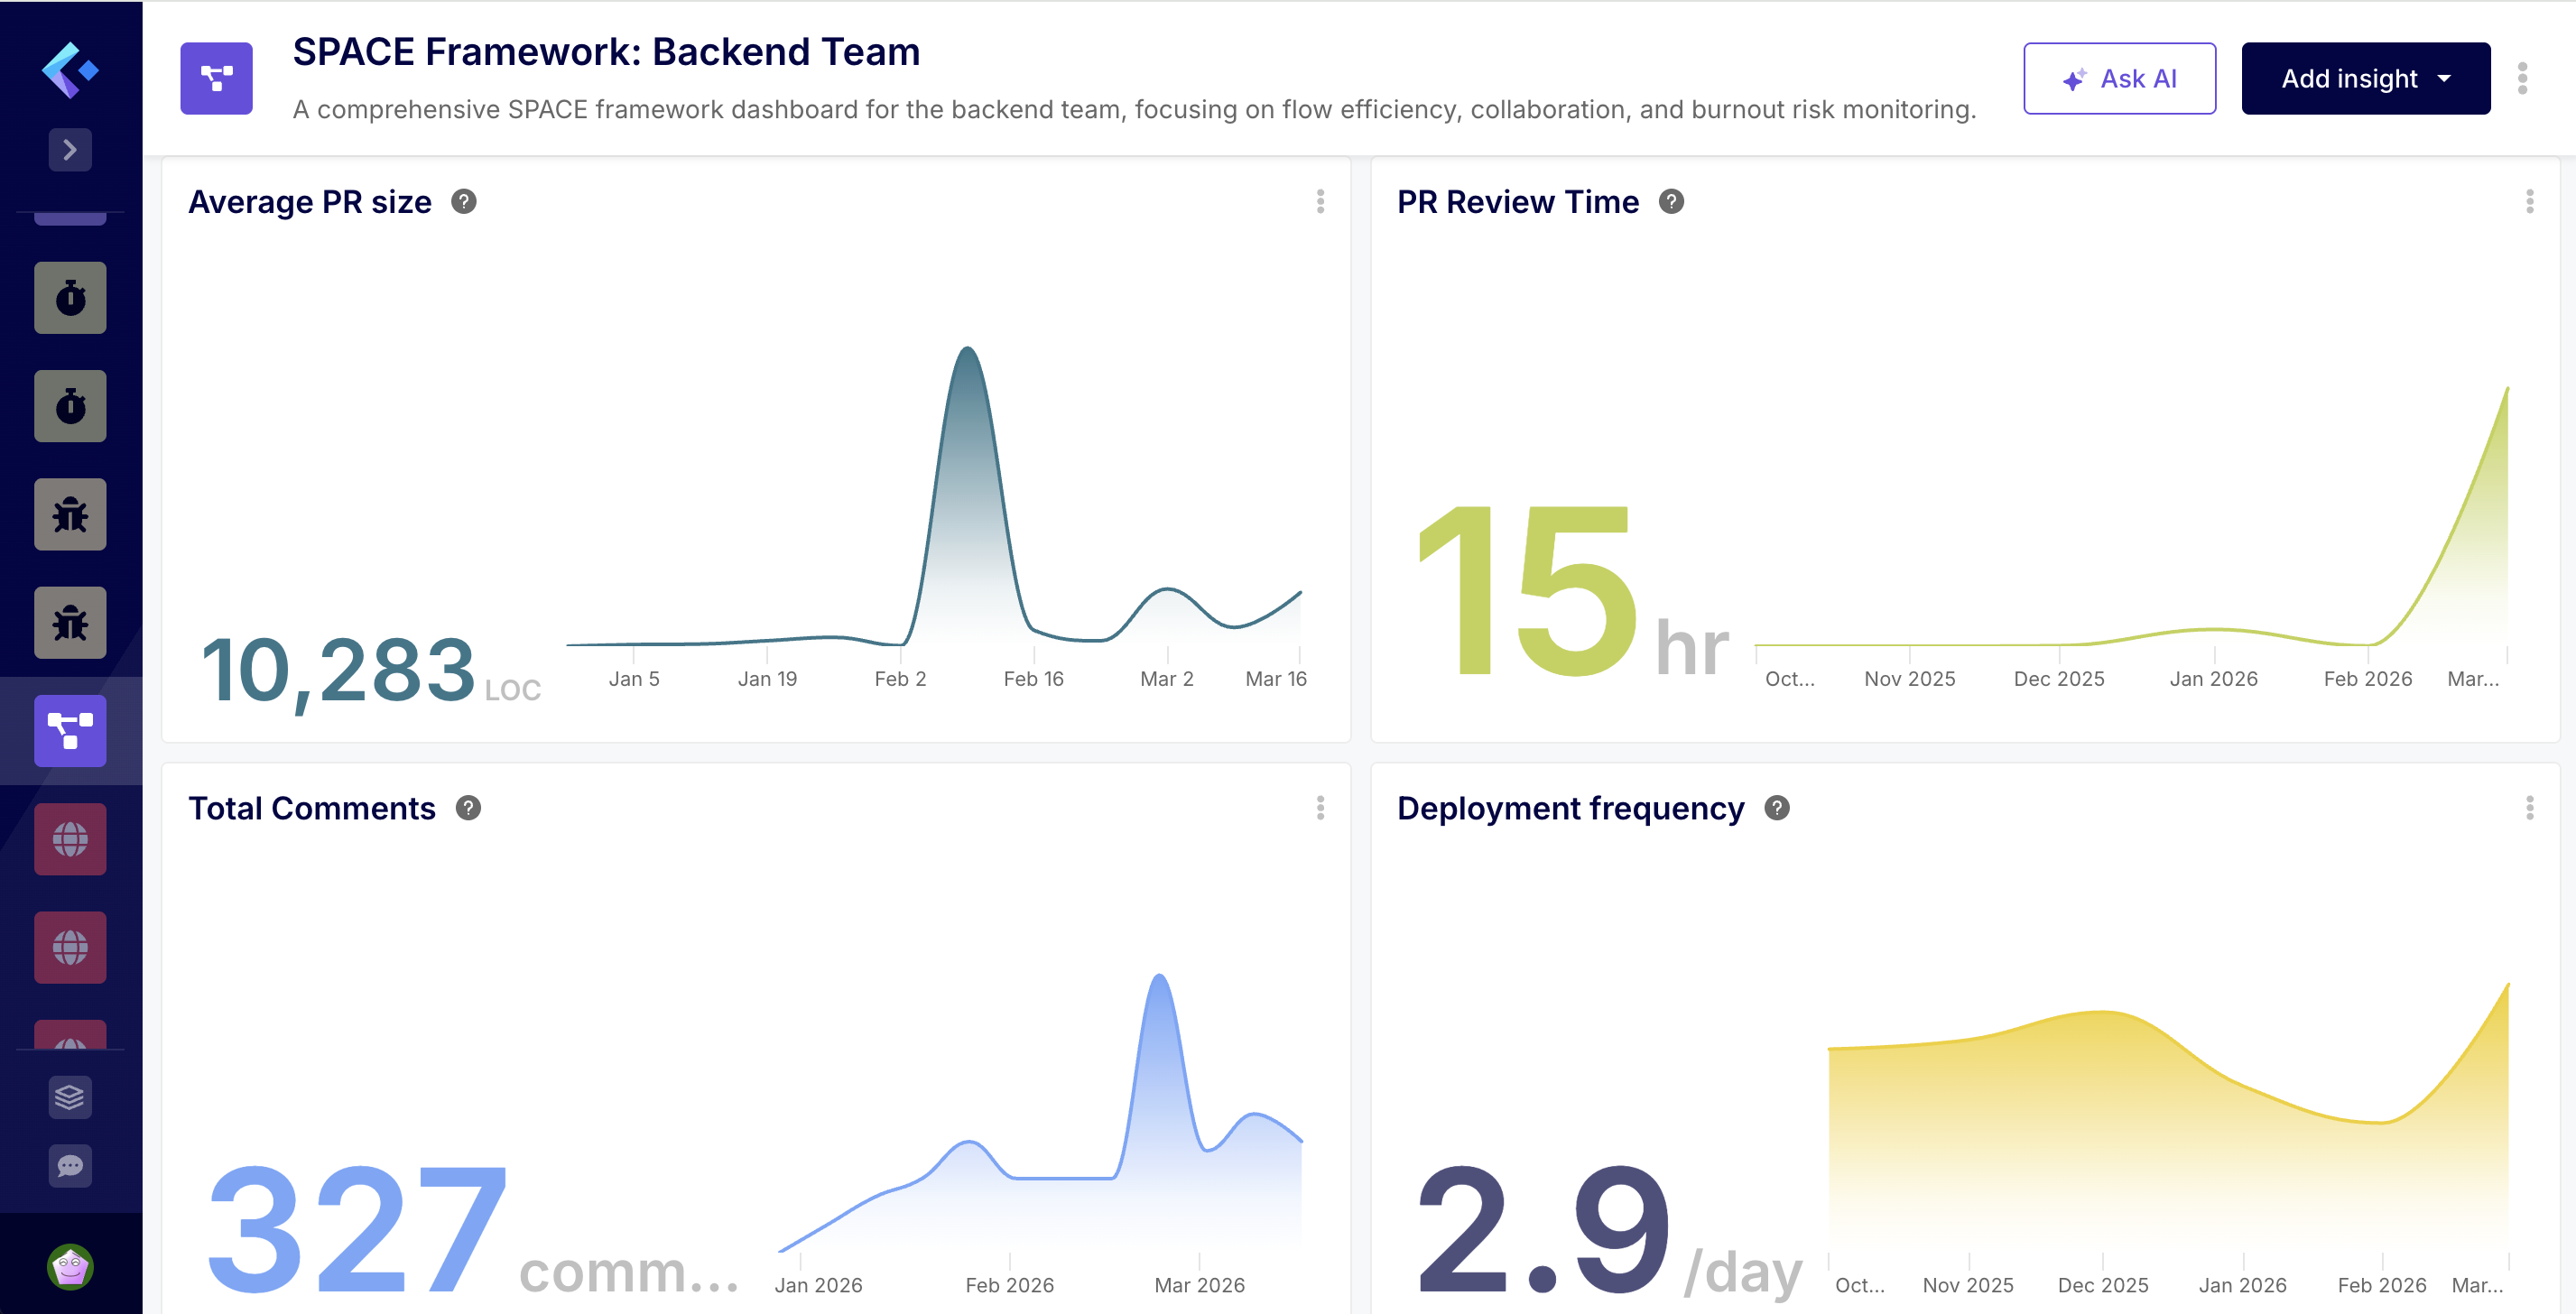
- High Output, Large Batches: Your Deployment Frequency is strong, averaging 3.1 merges per day in March.
- Alarming PR Sizes: The Average PR Size is 10,198 LOC. This is extremely high compared to the industry standard of 250–400 LOC. A specific spike in week 07 of 2026 reached 24,180 LOC.
- The Batch Problem: Shipping 3 times a day but in 10k LOC chunks suggests that these are not “incremental” changes but massive, bundled updates. This increases the risk of regressions and makes code reviews nearly impossible to perform thoroughly.
3. Communication & Collaboration (C)
- The “Review Hero” Bottleneck: The Collaboration Heatmap reveals that John Foo is the primary reviewer for almost the entire team. While John is highly active, this creates a significant single point of failure and a knowledge silo.
- Commenting Volume: Total commenting activity is relatively low (330 total), with a weekly trend ranging between 3 and 30 comments. For the size of the PRs being merged, this level of discussion seems low, potentially indicating that reviews are being expedited or “rubber-stamped” due to their massive size.
4. Efficiency & Flow (E)
- Low Flow Efficiency: Your Flow Efficiency is at 10%, meaning PRs spend 90% of their lifecycle in an “idle” or “waiting” state.
- Review Cycle Crisis: The PR Review Time has spiked to 95.5 hours in March (up from almost zero in previous months).
- The Bottleneck Synthesis: The massive PR sizes (10k+ LOC) are directly causing the low flow efficiency and the review time spike. Reviewers (primarily John Foo) are likely overwhelmed by the volume of code per PR, causing them to sit in the queue for days, which in turn necessitates the “after-hours” work seen in the burnout index to clear the backlog.
- The Recommendations: The AI agent offers recommendations based on the analysis.
📈 Key Recommendations
- Enforce Smaller PRs: This is the single most impactful change. Reducing PR size to under 500 LOC will naturally improve Flow Efficiency, lower Review Time, and reduce the need for after-hours work.
- Distribute the Review Load: Encourage other senior members (like twilliams-kp or adamaziz15) to take on more review responsibilities to alleviate the pressure on John Foo.
- Investigate February’s Burnout Spike: Review the project timeline for February 2026 to see if that pressure was avoidable or if it’s likely to recur in the coming months.
Use Case C: The "DevEx & Flow Optimization" Dashboard
The Problem: You have a high-performing team, but the roadmap isn't moving as fast as the Jira board suggests. You suspect "Shadow Work"—significant engineering effort happening in GitHub (bug fixes, refactoring, or "quick wins") that was never captured in a Jira issue. This untracked work is a silent killer of your Team Benchmark and artificially inflates your Cycle Time.
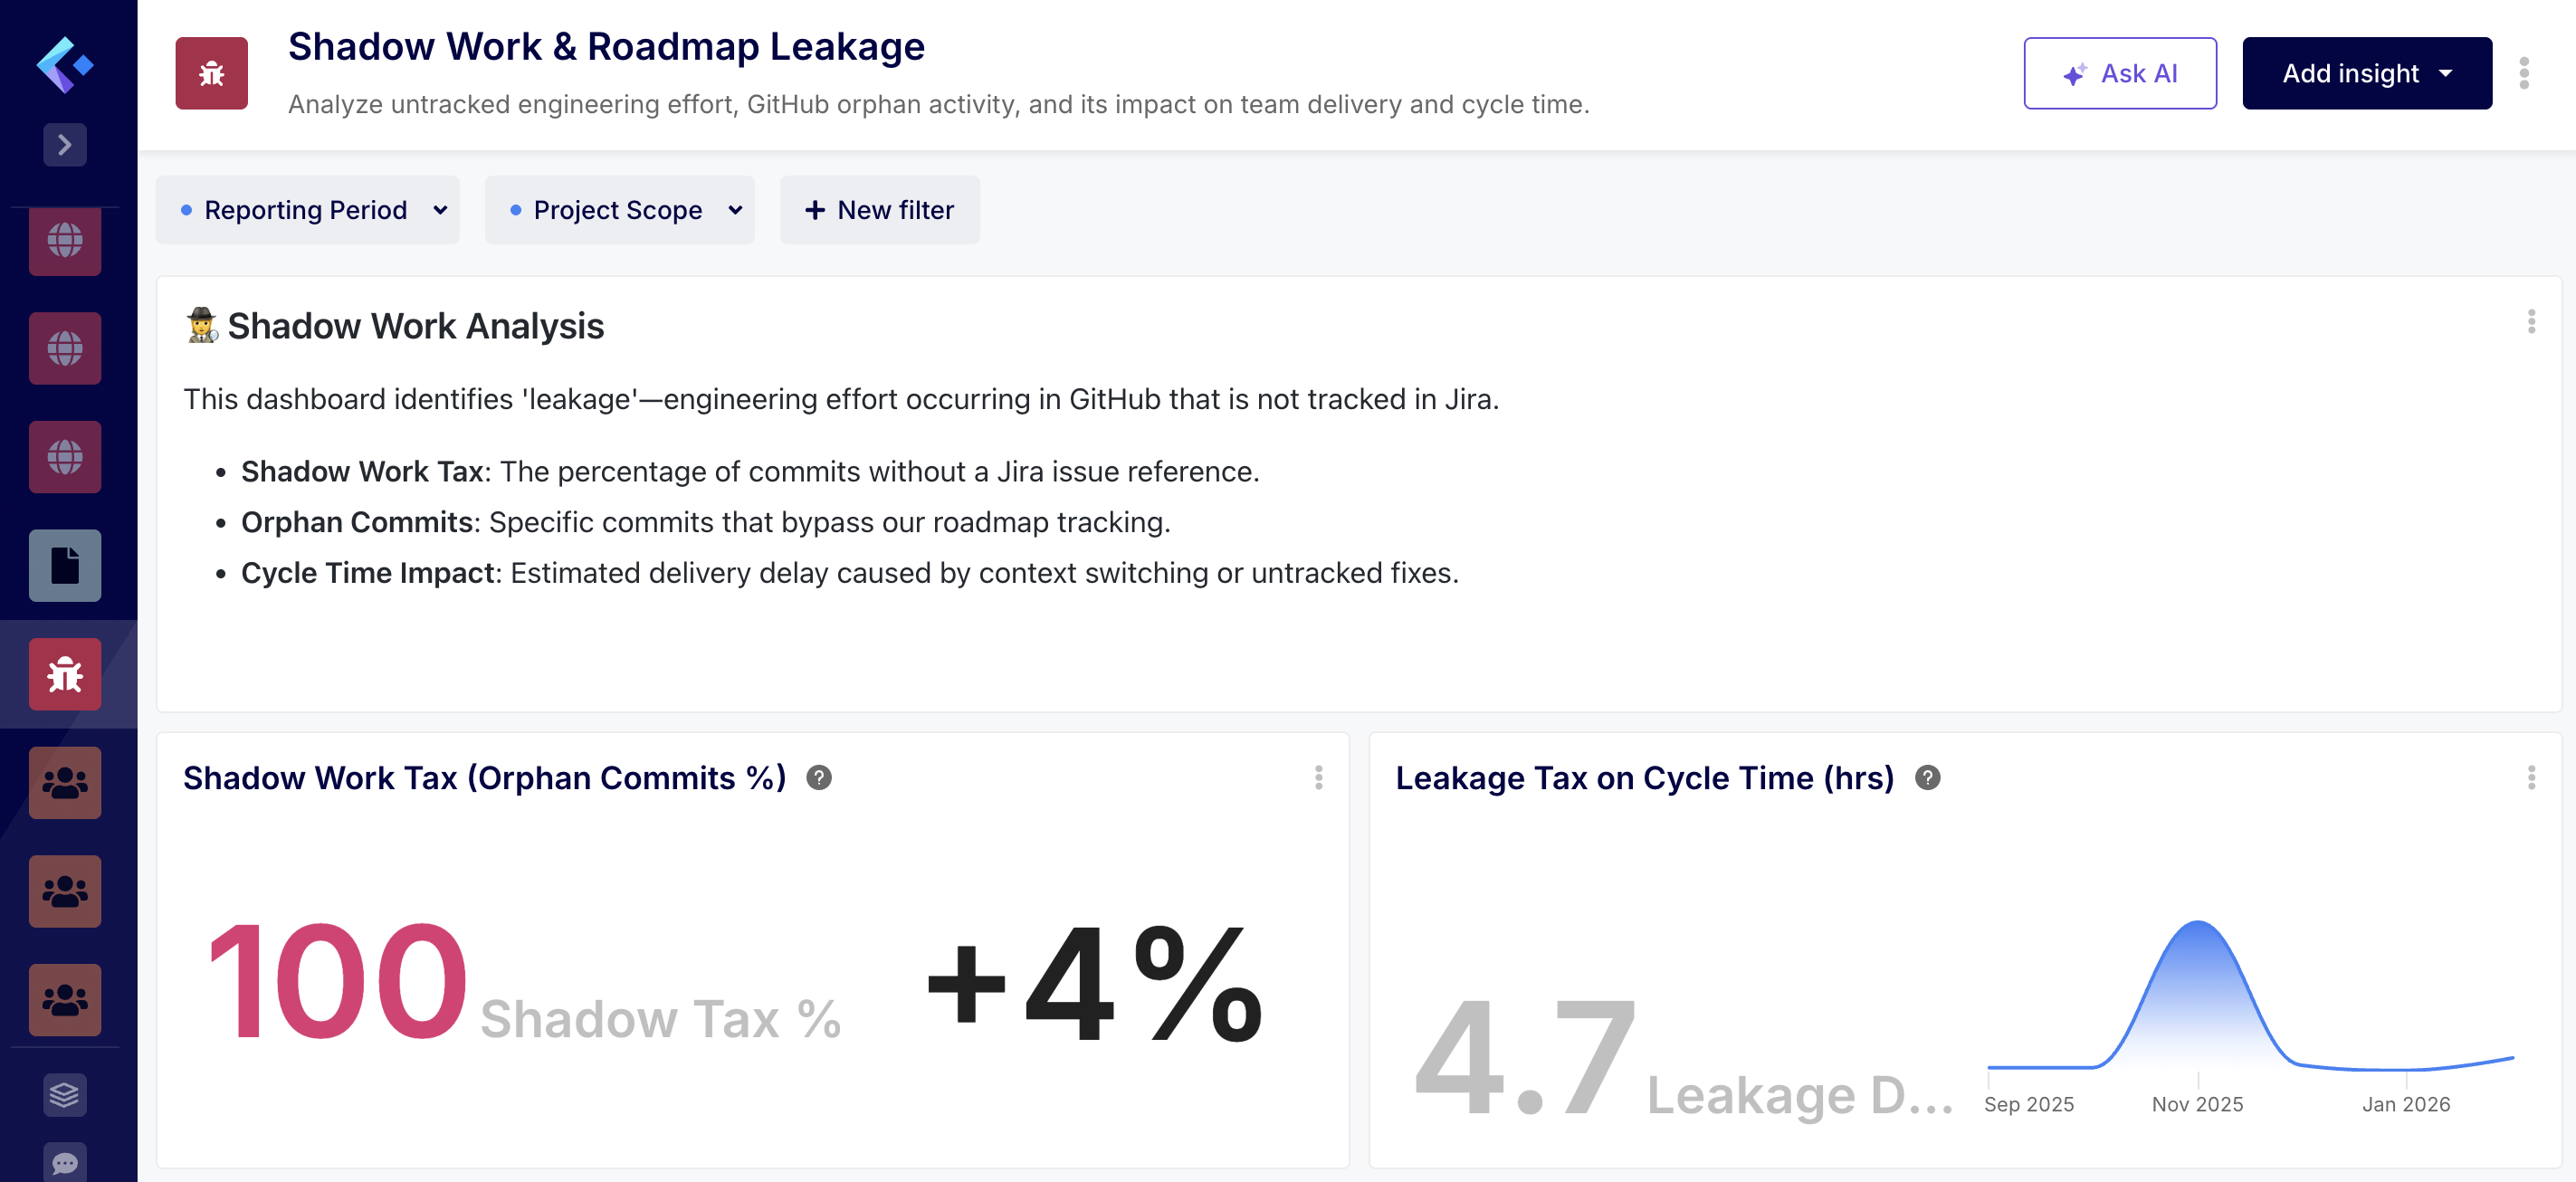
🤖 The Prompt: "Build a 'Shadow Work & Roadmap Leakage' dashboard. Compare our GitHub commit density against our Jira Issue completion rate for the 'Core-Services' team. Detect 'Orphan Commits'—GitHub activity not linked to a Jira issue—and calculate the 'Tax' this untracked effort is putting on our actual Cycle Time. Benchmark this against our performance from last quarter and suggest an automation to reconcile this leakage."
Why this is advanced:
- Deep SDLC Traceability: The AI Agent performs a cross-tool reconciliation. It scans every GitHub commit hash and Pull Request to see if they contain a valid Jira Issue key. It then quantifies the "Orphan Effort"—the percentage of your engineering capacity that is "invisible" to the business.
- The "Cycle Time Tax" Calculation: This is uniquely Keypup. The AI doesn't just list unlinked work; it calculates how much faster your Jira Cycle Time would be if your team wasn't being distracted by shadow work. It turns "untracked work" into a tangible efficiency loss percentage.
💡 Detailed Data Analysis
The analysis of your “Shadow Work & Roadmap Leakage” data reveals a significant and increasing trend of untracked engineering effort over the past year.
1. Shadow Work Tax & Orphan Activity
- The Shadow Work Tax—the percentage of commits that bypass Jira tracking—is currently at 100% for February 2026, up from 95.7% in January. This indicates that almost all recent code changes are being made without a corresponding Jira issue reference.
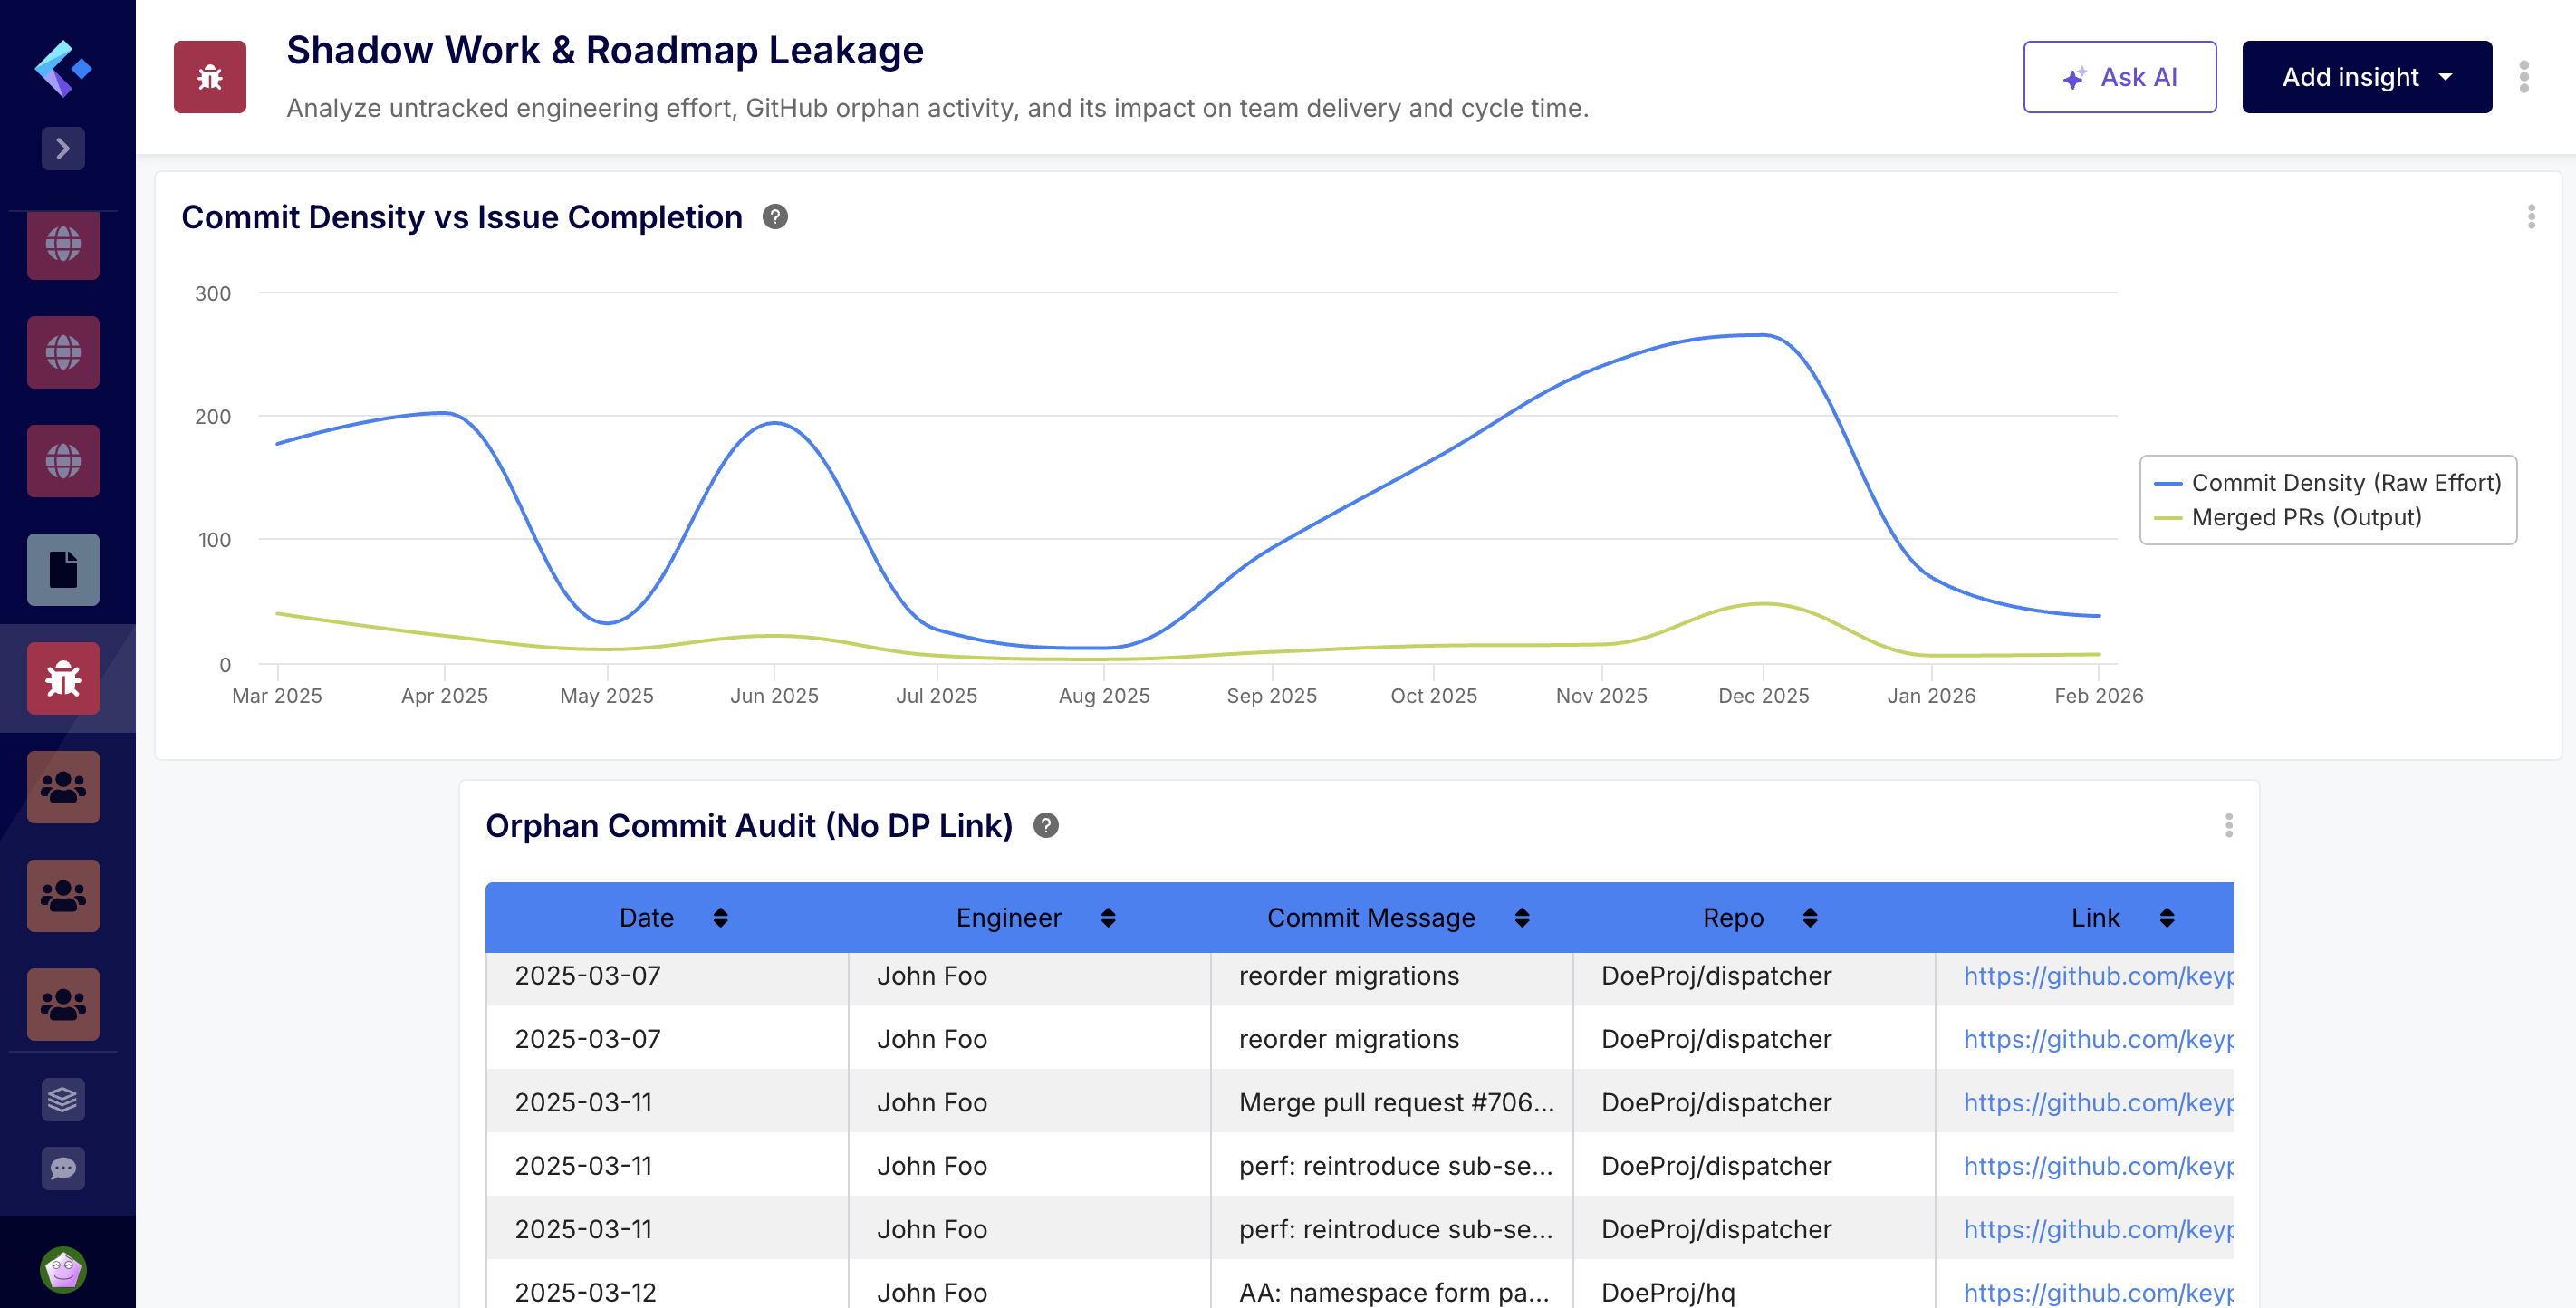
- The Orphan Commit Audit table highlights a high volume of activity from John Foo across both the dispatcher and hq repositories. Many of these commits appear to be related to releases, database migrations, and security updates (e.g., “[sec] upgrade uri”), which are critical but clearly not being captured in the primary roadmap.
2. Delivery & Cycle Time Impact
- The “tax” on your team’s delivery is quantifiable.
- Leakage Drag: In February 2026, untracked pull requests added an average of 4.7 hours to the cycle time.
- Trend: This drag peaked significantly in November 2025 at 51.2 hours, suggesting a period of intense “off-roadmap” work that likely disrupted planned sprint goals.
3. Effort vs. Tracked Output The Commit Density vs Issue Completion chart shows a persistent gap between raw effort and tracked output. While raw commit volume fluctuates (peaking at 265 in December 2025), the number of merged PRs remains relatively low (between 3 and 48 per month). This suggests that a large portion of the engineering bandwidth is consumed by maintenance or unassigned tasks that do not move the needle on documented project milestones.
- Prescriptive Remediation: The AI Agent analyzes the type of shadow work. It might conclude: "70% of our shadow work is 'Small Bug Fixes' that bypass the sprint. This suggests our Jira workflow is too heavy for minor tasks."
- The Recommendations: The AI agent offers recommendations based on the analysis.
📈 Key Recommendations
- Enforce Jira Linking: Consider implementing a Git hook or CI check to require a Jira key in commit messages for the DoeProj repositories.
- Capture Maintenance in Jira: Even security patches and releases should be represented by “Maintenance” or “Release” issues in Jira to ensure the roadmap accurately reflects team capacity.
- Analyze High-Leakage Periods: Review the events of November 2025 to understand what caused the 51-hour drag on cycle time and whether those types of requests can be better managed in the future.
- Increase Visibility: This dashboard suggests that your team is working hard, but much of that work is “invisible” to stakeholders. Bringing this effort into Jira will improve both capacity planning and roadmap accuracy. 🕵️
By moving to an NLP Software Development Analytics model, we are removing the "Management Overhead" that plagues modern engineering.
CTOs can now get the answers they need in the time it takes to type a Slack message. Engineering Managers are freed from the drudgery of dashboard maintenance and can focus on coaching and architecture. Developers are protected by an AI that actively monitors for burnout and process friction.
This isn't just a product update. It is the beginning of prescriptive engineering.
6. How to Get Started with Keypup NLP
This new capability is now live for all Keypup Enterprise customers.
- Connect: Link your GitHub, GitLab, Azure DevOps, Jira, and Trello accounts.
- Prompt: Navigate to the "AI Agent" and type your first dashboard request.
- Optimize: Let the AI analyze your data, take the suggestions, and watch your delivery velocity soar.
The future of engineering isn't built. It's prompted.
Are you ready to stop building and start leading?
Experience the Power of NLP Analytics Now